pete12345
Well-Known Member
- Posts
- 2,432
- Location
- Isle Sheppy
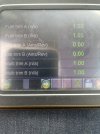
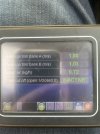
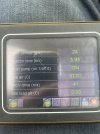
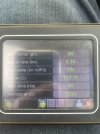
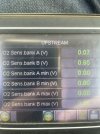
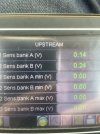
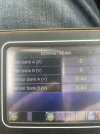
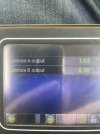
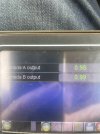
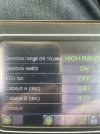
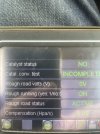
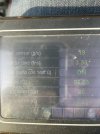
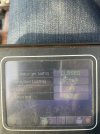
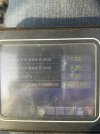
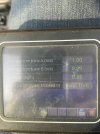
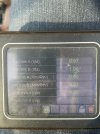
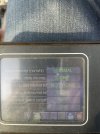
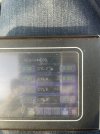
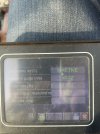
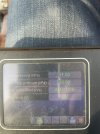
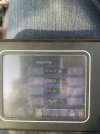
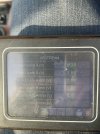
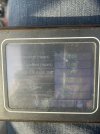
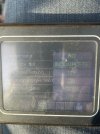
Here’s a few pics I took of readings before & after a 40miles drive I’ve got live data aswell will try to up load it later can anyone spot a major change or problems just from the pics


Attachments
-
 IMG_3684.jpeg346.6 KB · Views: 9
 -
 IMG_3685.jpeg351.9 KB · Views: 10
 -
 IMG_3686.jpeg376.3 KB · Views: 6
 -
 IMG_3687.jpeg372.1 KB · Views: 7
 -
 IMG_3688.jpeg294.6 KB · Views: 7
 -
 IMG_3689.jpeg277.7 KB · Views: 7
 -
 IMG_3690.jpeg358.8 KB · Views: 7
 -
 IMG_3691.jpeg332.8 KB · Views: 7
 -
 IMG_3692.jpeg325.7 KB · Views: 8
 -
 IMG_3693.jpeg312 KB · Views: 8
 -
 IMG_3694.jpeg324.6 KB · Views: 5
 -
 IMG_3695.jpeg333.8 KB · Views: 7
 -
 IMG_3701.jpeg458 KB · Views: 6
 -
 IMG_3696.jpeg414.5 KB · Views: 7
 -
 IMG_3697.jpeg411.7 KB · Views: 5
 -
 IMG_3698.jpeg462.3 KB · Views: 7
 -
 IMG_3703.jpeg443.5 KB · Views: 7
 -
 IMG_3704.jpeg451.6 KB · Views: 7
 -
 IMG_3699.jpeg455.7 KB · Views: 7
 -
 IMG_3700.jpeg424.6 KB · Views: 5
 -
 IMG_3705.jpeg440.9 KB · Views: 6
 -
 IMG_3710.jpeg448.7 KB · Views: 5
 -
 IMG_3709.jpeg464.8 KB · Views: 6
 -
 IMG_3708.jpeg468.9 KB · Views: 6
 -
 IMG_3707.jpeg447.9 KB · Views: 6
 -
 IMG_3706.jpeg438.4 KB · Views: 4
 -
 IMG_3712.jpeg418.6 KB · Views: 7
 -
 IMG_3711.jpeg459.3 KB · Views: 6
 -
 IMG_3714.jpeg461.6 KB · Views: 5
 -
 IMG_3715.jpeg435.3 KB · Views: 5
 -
 IMG_3720.jpeg466.3 KB · Views: 6
 -
 IMG_3719.jpeg419.3 KB · Views: 6
 -
 IMG_3717.jpeg485 KB · Views: 6
 -
 IMG_3716.jpeg472.6 KB · Views: 5
 -
 IMG_3713.jpeg452.8 KB · Views: 5
