If applying enough force (1.2m and 8kg) to test the vcu in its linear zone then it can be quite accurate. One full turn of the vcu is enough to mix the fluid round so its even. If you repeat the test continuouly after this, results will be the same.
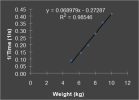
Makes total sense to me - I think its a great benchmark test, very well thought out to be simple and repeatable, yet give good data.

I cant do anything about the inevitable variation between different people's tests, but I can make sure its minimised within my tests to make them as repeatable as possible.

Especially as I will mainly use it to see how my VCU degrades (as well as carefully comparing it with other peoples values)
And I like to video tests as its easy with a phone and VLC is simple software

My Freelander specialist mechanic drained and replaced the fluid with his own formulation, so it probably wont behave exactly like everyone else's
And its much hotter here, I use car for short trips infrequently and 95% on the road, although roads are really terrible here (I laugh at your so-called 'potholes'!), my driving style is different, I might be more/or less finicky about the experiment, It might be Friday afternoon, etc etc
 
Well, ..... I was going to video ......

But it took approx 2 seconds :oops:

So, as I was on my own, no time to get video going (and no need anyway) and I had to use the highly accurate '1 elephant, 2 elephants ...' method :D

1.2 m (40 x 25 mm pine batten)

8 kg (sand in 5l can, weighed on bathroom scales)
EDIT: DRY sand density is around 1.5 kg/m^3 so for 8 kg I needed approx 5 1/3 litres of DRY sand

No other wheels were turning

Wait a minute. Should I have had it in gear to stop the front half of the prop turning?
EDIT: Apparently not:
"Q. How do you do the test?
A. Chock front wheels. Release handbrake. Doesn't matter if it's a manual or automatic gearbox, or what position the gearbox is in"

signal-2024-09-03-113932_006.jpeg
signal-2024-09-03-113932_011.jpeg
 
Last edited:
Car should be in gear for test
Re-did test in 1st, then Reverse, then 4th.
Even tried it anticlockwise as well

No difference - under 2 seconds

Temp here hasn't been very hot today, max 25 C
I didn't drive before tests

So no problems with overloading the drivetrain, but how could I check if 4x4 is kicking in? It does 'feel' like it is but how can I be sure (preferably without risk of getting stuck somewhere) :)

EDIT: Is there a database of test results (with weight, length and rough mileage) anywhere so that I could check my result against others with brand new VCU's?
:)
 
Last edited:
Still not sure I have a problem.
I did see one set of results somewhere in this thread of 4 seconds for a new VCU with 8 kg but I couldnt see how long the bar was, and cant find it again
It was @mrblockpaving
https://www.landyzone.co.uk/land-rover/vcu-torque-test-results.109486/post-2229514

"Just fitted newly recoditioned Vcu from Bell Engineering, less than 50 miles ago,"
"8kg= 3.6 sec"
Doesnt say if it were 1.2 m bar or not, if it was 1 m then it would be enve quicker than 3.6 s
Was it 3.6? at that time stopwatch reaction times would be significant?

So, I am thinking that my 2 s could be fine

My Freelander mechanic, Nuno, only works on Freelanders and off-roads a lot and is definitely someone who knows his stuff and I trust. He is a great human bean.
He said he developed his formula together with another of their off-road group.
I wonder if he tailored it for the hotter temps down here, or to get different to 'standard' behaviour?

I am thinking of putting sand under the front wheels in the road and seeing if I can wheelspin to see if it is going into 4WD.
Would that work?

In any case, I will keep checking (yearly?) to make sure the 1.2 m 8 kg OWUT time doesnt go up too much
 
I am surprised at the 2 second result, (mine was nearer 50 seconds with 5kg at 1.2m and about 15 degrees ambient temperature, to go from 45 degrees to horizontal)! I find it hard to believe that with a 2 second fall time, it would transmit much useful drive to the rear wheels.

I think, if it were my car, I would find an up-hill slope with poor grip (a sand hill or some grass or gravel) and just try to drive up it with people watching (or better, filming) the wheels on each side of the vehicle. If it's an up-hill slope and you lose traction, at least you can roll back down again!

I think the problem with trying to put sand on the road to induce wheelspin, is that you might need a second or two of lost traction before you can be sure that drive is being transmitted to the rear wheels.
 
Last edited:
2 seconds suggests to me there is little or no fluid in it, or some random stuff like hydraulic oil or something.

BTW, I don't think it matters if the car is in gear or not for the test if the other three wheels are on the ground, but it obviously should be from a safety perspective.
 
The OWUT test is done on the rear wheel. Doesn't matter what gear it is in as the vehicle won't be moving. Front prop will be stationary unless something is missing/broken.

@Bife
Get the car on wet grass. Pull away fast to wheel spin it. Get someone to film BOTH rear wheels to see if they spin or just roll as the car moves forwards.

We had a database a decade ago. Few filled it out.
 
Well, I tried to find a wet grassy slope in Summer in my part of Portugal and no luck :)

But joking aside, thanks for the advice from all

I went out yesterday looking for a sandy slope and found some 45 degree banks which I pretty easily climbed up onto with some very limited front wheelspin, but they weren't high enough to be conclusive - i got on top before slipping.

So I went looking further and came around a corner and came into level but pretty deep (over a foot) very loose sand by mistake and had to stop. I managed to pull backwards out with not much problem at all and even turn around

I called Nuno the mechanic, who is definitely not the type to rip me off (I've known him for a few years now and get on really well with him) and he said to bring it back round.

This morning I did, and he put it up on the ramp and was surprised to find that it was indeed a bit 'loose'. I saw him use his two long thin screwdrivers to check the torque to move / keep moving the VCU (he does it by feel, I can understand this having worked in Dad's workshop, you get to feel how much torque is without a torque wrench) and they bent less than when he tried it just after mounting the VCU a week or two ago. He said he had no idea why, since he had used his usual mix, but that the fluid must have mixed and that was the first case he had had like that, but that of course he would redo it no discussion or cost. He also checked the conical bolt he uses to close the VCU and there were no leaks.

Then I told him about the slight knock I have since putting the VCU on and he felt the prop slack, mountings etc etc and thought that perhaps the IRD / Rear Diff might be 'ageing' due to a stiff VCU and general wear (190K km).

Then he took me out for a spin in it around a track nearby to see if it was going into 4WD. This had lots of very deep sand flat bits and very steep parts (45 degrees or so for me is steep) some hard, some hard with sand and some with deep sandy bits. No problems at all. He said that as expected the VCU needed a bit more (second) front spin to pull in but that it was definitely transferring drive to the back. There is no question of that, he even went into deep sand then put it on full lock, stopped and then just came out. He pointed out that driving around was smooth as well, a good sign apparently. We ended up out for an hour and half with him giving me some tips, checking traction control and hill descent (both fine) and generally having a great time.

At the end the VCU was too hot to hold, but not hot enough to burn my hand

So we talked about it and I decided that for now, given that where we went was way more challenging than I will ever consider going, we would keep the slacker VCU (which no doubt will get stiffer with time) as it is, in order to 'protect' the IRD / Diff. Then when / if I need to change either IRD / Diff he will redo the VCU free of charge. Or if I change my mind.

The thing is, the OWUT is great as I understand it is meant to be used; to indicate a degraded (as in stiff) or degrading VCU, but that doesn't mean that there can not be different results between different cases, especially when custom fluid blends are used (Nuno says he blends a slack and a stiff fluid). In my case, I think it identified a slack VCU well, but that doesn't mean that the VCU is no good.

As far as I can see, the test only tests at low shear rates, which are no doubt indicative of the behaviour at higher shear rates (i.e. if your VCU is too stiff at low shear rate then its pretty sure it will be too stiff at higher shear rates) but it cant test the behaviour at higher shear rates (e.g. for my case I am sure that its slack at low shear rates but is transferring very significant drive to rear when really required)

So, IMO the test is great for what it is supposed to do, and I will be carrying on doing it (I will try at 6 monthly periods but cant promise I will!). I think the most important results are those of high times w.r.t others' results &/or significant increases in times with use wrt to your own times

Well, I am happy anyway!

Thanks again to all!
 
Others will have different views but my rules of thumb are :

20 to 30 secs is as new or recon.
45 secs is monitor and keep an eye pending change.
60 secs is replace within 6 months.
Over 60 secs replace immediately.

With 120cm.and 5Kg
what would you say these were for 1.2m and 8 kg?

From my ramblings here a pretty good 'engineering assumption' would be that weight (W) x stick length (L) should roughly be proportional to 1 / time for OWUT

so if we do the test on the same VCU with weight W1, and then with a different weight W2 (Both cases using the same length stick, whatever it is), and if the first test with W1 gives a time of t1 then the time for the second test t2 would be around:

t2 = t1 x (W1/W2) Equation (1)

As a rough and ready check, if W2 > W1 then that equation gives t2 < t1, i.e a faster time for a heavier weight so we are on the right lines

So, to convert (roughly) tests done for a stick of 1.2 m with a weight of 5kg to be able to compare them (at least roughly) with tests done with a 1.2 m stick (that's important) BUT with an 8kg weight we can simply times them by 5/8 (0.625)

Doing that (and rounding to nearest tens) gives my adjusted versions of @andyfreelandy 's guidelines:

10 to 20 secs is as new or recon.

30 secs is monitor and keep an eye pending change.

40 secs is replace within 6 months.

Over 40 secs replace immediately.


With 120cm.and 8Kg (EIGHT kg)

I'd just like to say that this is no way endorsed or otherwise by @andyfreelandy - I just used his results and did my own thing on them

I bet my values arent accurate but they could be a good enough engineering guestimate to allow some sort of comparisons

We could do exactly the same thing if we change the stick length L, to give comparisons for different stick lengths by changing W1 and W2 for L1 & L2 in my equation (1) above, keeping the Weight the same:

t2 = t1 x (L1/L2) Equation (2)

For example to 'change' times with a 100 cm bar to a 120 cm to make valid comparisons, just multiply the times for a 100 cm bar by 100/120, or 5/6 (0.833)

Or even allow for changes in both Stick Length AND Weight at the same time by swapping W1 & W2 for W1xL1 and W2xL2, respectively:

t2 = t1 x [(W1xL1)/(W2xL2) ] Equation (3)

For example to 'change' times with a 100 cm bar with 5 kg to a 120 cm bar with 8 kg to make valid comparisons, just multiply the times for a 100 cm bar with 5 kg by:

[(100*5)/(120*8)] = 25/48 = 0.52 which is as near as dammit a half!

1f84bc5524c2f650.jpg
 
Last edited:
what would you say these were for 1.2m and 8 kg?

From my ramblings here a pretty good 'engineering assumption' would be that weight (W) x stick length (L) should roughly be proportional to 1 / time for OWUT

so if we do the test on the same VCU with weight W1, and then with a different weight W2 (Both cases using the same length stick, whatever it is), and if the first test with W1 gives a time of t1 then the time for the second test t2 would be around:

t2 = t1 x (W1/W2) Equation (1)

As a rough and ready check, if W2 > W1 then that equation gives t2 < t1, i.e a faster time for a heavier weight so we are on the right lines

So, to convert (roughly) tests done for a stick of 1.2 m with a weight of 5kg to be able to compare them (at least roughly) with tests done with a 1.2 m stick (that's important) BUT with an 8kg weight we can simply times them by 5/8 (0.625)

Doing that (and rounding to nearest tens) gives my adjusted versions of @andyfreelandy 's guidelines:

10 to 20 secs is as new or recon.

30 secs is monitor and keep an eye pending change.

40 secs is replace within 6 months.

Over 40 secs replace immediately.


With 120cm.and 8Kg (EIGHT kg)

I'd just like to say that this is no way endorsed or otherwise by @andyfreelandy - I just used his results and did my own thing on them

I bet my values arent accurate but they could be a good enough engineering guestimate to allow some sort of comparisons

We could do exactly the same thing if we change the stick length L, to give comparisons for different stick lengths by changing W1 and W2 for L1 & L2 in my equation (1) above, keeping the Weight the same:

t2 = t1 x (L1/L2) Equation (2)

For example to 'change' times with a 100 cm bar to a 120 cm to make valid comparisons, just multiply the times for a 100 cm bar by 100/120, or 5/6 (0.833)

Or even allow for changes in both Stick Length AND Weight at the same time by swapping W1 & W2 for W1xL1 and W2xL2, respectively:

t2 = t1 x [(W1xL1)/(W2xL2) ] Equation (3)

For example to 'change' times with a 100 cm bar with 5 kg to a 120 cm bar with 8 kg to make valid comparisons, just multiply the times for a 100 cm bar with 5 kg by:

[(100*5)/(120*8)] = 25/48 = 0.52 which is as near as dammit a half!

View attachment 325781


I don't think a VCU behaves linear manner, to be honest. In other words, I don't think a 10kg weight at 1.2m will take half the time of a 5kg weight at 1.2m. Hippo is our VCU expert on here. He has done a lot of testing with different weights at different lengths (and I think, on the same VCU). He might be able to give you better figures.

But let's look at it another way...

If that's as a result of having a 5kg weight at 1.2m, that's a torque of 1.2 x 5 x 9.81 = 59Nm, BUT ONLY at the point where the bar is horizontal. That's the thing with this test, you are not applying a constant torque. When the bar is at 45 degrees, you are only applying 0.707 times that torque = 42Nm. But even so, these are relatively small torques. They would not provide much useful tractive effort at the tyre footprint.

Turning the wheel through 45 degrees, is 1/8 of a revolution. Let's say it takes 30 seconds to do that. So if we multiply that by 8, we get 240 seconds to do one revolution, which means the wheel is turning extremely slowly. 1/4 RPM. Again, we can't say this, because it turns very slowly at 45 degrees, and faster as the bar gets to 90 degrees, but we can certainly see that it is turning very slowly.

I think that when the wheel is doing 5 or 10 RPM, the torque being transmitted by the VCU will be MUCH higher. They're just not linear devices.

Here's a graph that Hippo did, earlier in this thread, using different weights on the bar.

 
No, you are right, it is not linear with time, but not far off linear with 'N' in RPM (1/time)
These are Hippo's results plotted as 1/time vs Weight:
1726127135409.png

Its not linear, but not far off, I think near enough for very rough back of fag packet comparisons, especially between 5 & 10 kg

1726128472692.png

R-squared = 1.0 is a perfect fit so its an almost perfect linear fit from 5 to 10 kg (I didnt include R squared on 1st plot above for whole rangeas it is a classic case where R-squared will be high without a perfect fit due to the symmetric bend in the curve - sorry, that's stats)

If you wanted to be more accurate over the whole range of weights a simple power law like the below will give you a very good fit indeed to the data but I think that that is not really necessary as no-one normally does the test with weight a outside the range of 5 kg to 10 kg AFAIAA

1726127355712.png


Effectively, my previous post just says the RPM should be roughly proportional to the torque applied
Which means that the time taken should be inversely proportional to the torque applied

I dont think the angles as it goes round the arc are important as they are always pretty much the same in both cases I am trying to compare , and I am not trying to predict the time in each case, just compare one case with another with the same angles, so you end up with something like (Angles / Same Angles) which is 1

"I think that when the wheel is doing 5 or 10 RPM, the torque being transmitted by the VCU will be MUCH higher. They're just not linear devices."
Absolutely, but I am only trying to compare two cases at pretty much the same RPM (the very slow one of the OWUT) with respect to the range or RPPM seen in normal operation

In general, I am just trying to make comparisons between two cases when pretty much everything except the torque applied is the same, and even the two torques applied arent hugely different, and hopefully not enough to give differences in behaviour (Although the slight non-linearity of the first plot above does show that there are some differences in behaviour at the highest and lowest torques in that plot, and maybe that is one of the reasons why?)

All I'm trying to do is work out how to compare a 5 kg test result with an 8 kg result, for example, or a 1 m bar result with a 1.2m result, not describe the whole operating range of the VCU
 
Last edited:
No, you are right, it is not linear with time, but not far off linear with 'N' in RPM (1/time)
These are Hippo's results plotted as 1/time vs Weight:
View attachment 325791
Its not linear, but not far off, I think near enough for very rough back of fag packet comparisons, especially between 5 & 10 kg

View attachment 325793
R-squared = 1.0 is a perfect fit so its an almost perfect linear fit from 5 to 10 kg (I didnt include R squared on 1st plot above for whole rangeas it is a classic case where R-squared will be high without a perfect fit due to the symmetric bend in the curve - sorry, that's stats)

If you wanted to be more accurate over the whole range of weights a simple power law like the below will give you a very good fit indeed to the data but I think that that is not really necessary as no-one normally does the test with weight a outside the range of 5 kg to 10 kg AFAIAA

View attachment 325792

Effectively, my previous post just says the RPM should be roughly proportional to the torque applied
Which means that the time taken should be inversely proportional to the torque applied

I dont think the angles as it goes round the arc are important as they are always pretty much the same in both cases I am trying to compare , and I am not trying to predict the time in each case, just compare one case with another with the same angles, so you end up with something like (Angles / Same Angles) which is 1

"I think that when the wheel is doing 5 or 10 RPM, the torque being transmitted by the VCU will be MUCH higher. They're just not linear devices."
Absolutely, but I am only trying to compare two cases at pretty much the same RPM (the very slow one of the OWUT) with respect to the range or RPPM seen in normal operation

In general, I am just trying to make comparisons between two cases when pretty much everything except the torque applied is the same, and even the two torques applied arent hugely different, and hopefully not enough to give differences in behaviour (Although the slight non-linearity of the first plot above does show that there are some differences in behaviour at the highest and lowest torques in that plot, and maybe that is one of the reasons why?)

All I'm trying to do is work out how to compare a 5 kg test result with an 8 kg result, for example, or a 1 m bar result with a 1.2m result, not describe the whole operating range of the VCU

Er... OK... but that seems an odd thing to do? Surely what we're interested in, is the operating range of the VCU?! Indeed, one o the most frequent criticisms of the OWUT is that it is carried out way outside the operating range of the VCU, at such low toques and speeds that a slightly binding brake can make a big difference.

I'm sure you can regard the difference between a 5 and 8kg weight s being linear, but where it actually matters, we should be using a 50 or 80 kg weight!

Incidentally, Hippo's original graphs in that link I posted, were some way off being linear. Arguably linear at the higher weights, but way off at the lower ones:

1726130576626.png
 
Er... OK... but that seems an odd thing to do? Surely what we're interested in, is the operating range of the VCU?! Indeed, one o the most frequent criticisms of the OWUT is that it is carried out way outside the operating range of the VCU, at such low toques and speeds that a slightly binding brake can make a big difference.

I'm sure you can regard the difference between a 5 and 8kg weight s being linear, but where it actually matters, we should be using a 50 or 80 kg weight!

Incidentally, Hippo's original graphs in that link I posted, were some way off being linear. Arguably linear at the higher weights, but way off at the lower ones:

View attachment 325794
That's because the plot above is time vs weight, NOT one over time (1/time) vs weight. I wouldnt say that graph is linear anywhere


And yes, it would be nice to be able to investigate the behaviour under operating conditions and torques and rotations etc, but that is pretty much impossible so @Hippo cleverly developed a benchmark test that can give an indication of a ****ed or getting-****ed VCU. its pretty much like looking at the oil in a gearbox for metal particles - the metal particles dont cause the gearbox failure but they show it is happening.
This is not infallible, for example my VCU is still working even though it gives very quick times, but the OWUT identified it was a slack VCU and even though it is working it almost certainly isnt working in the same way as a stiffer one would

At the end of the day, if the VCU is stiff at low shear rates (RPM) then it is pretty much sure to be ****ed (probably more so) at the higher RPM when you are driving, and so it is an excellent way of checking if the VCU is OK or on its way out or ****ed

A test doesnt have to give accurate values, or even nothing other than trends with no absolute values, to give very useful information
 
If I do the same thing for @mrblockpaving 's results


I also got linear behaviour for weight verses 1/time, especially between 5 and 10 kg.

His was a slack VCU with fast times meaning any errors in timings will become more significant (i.e. his results will probly be a bit more scatter since its harder to accurately time short times).

The slope of the line is different to that of Hippo as its a different VCU (slacker) but that doesnt affect my method as it is only the linearity that is important for that specific 'scaling' from one weight to another

1726137306327.png


1726137321684.png


Anyway, all this is just out of my curiosity (and undoubtedly mine only)

The most important thing is that we have a rough guide to see if the VCU is OK, degraded or, most importantly, ****ed
AND it gives a very good indication if you repeat the test periodically (in the same way each time, whatever that is) if it is getting worse and how much worse it is getting


I would share my spreadsheet, but dont know how to in this forum
 

Attachments

  • 1726136201430.png
    1726136201430.png
    12.1 KB · Views: 7
  • 1726136232549.png
    1726136232549.png
    12.4 KB · Views: 8
Last edited:
at such low toques and speeds that a slightly binding brake can make a big difference.
Yes, I think we can see the effects of friction etc in the non-linearity of the 1/t vs weight graphs at the most lowest weights (<5kg) , but at higher weights they seem to be less significant which makes my method seem OK for 'scaling' OWUT results between different weights and lengths

That is completely independent of the discussion of whether the OWUT gives a good enough (i.e. useful) indication of normal driving behaviour

I think it absolutely does, as long as results are interpreted in terms of trends and rough ranges rather than as accurate values
 
Last edited:
Simplifying all the above, I think that:

1. to convert (roughly) tests done for a stick of 1.2 m (or any other length) with a weight of 5kg to be able to compare them (at least roughly) with tests done with a 1.2 m stick (or any other length as long as its the same) BUT with an 8kg weight we can simply times them by 5/8 (0.625)

2. Similarly, to 'change' times with a 100 cm bar to a 120 cm to make valid comparisons, just multiply the times for a 100 cm bar by 100/120, or 5/6 (0.833) to give a value you can compare with the 120 cm bar result

3. To 'change' times with a 100 cm bar with 5 kg to a 120 cm bar with 8 kg to make valid comparisons, just halve the times for a 100 cm bar with 5 kg to give a value you can compare with the 120 cm bar with 8kg result

NB!!! Above only roughly works, but I think enough to give a 'feel' for comparisons between values
 

Similar threads